
Newsroom
16 Sep 2026
Roaring Back: What Poland’s Industrial Market Boost Means
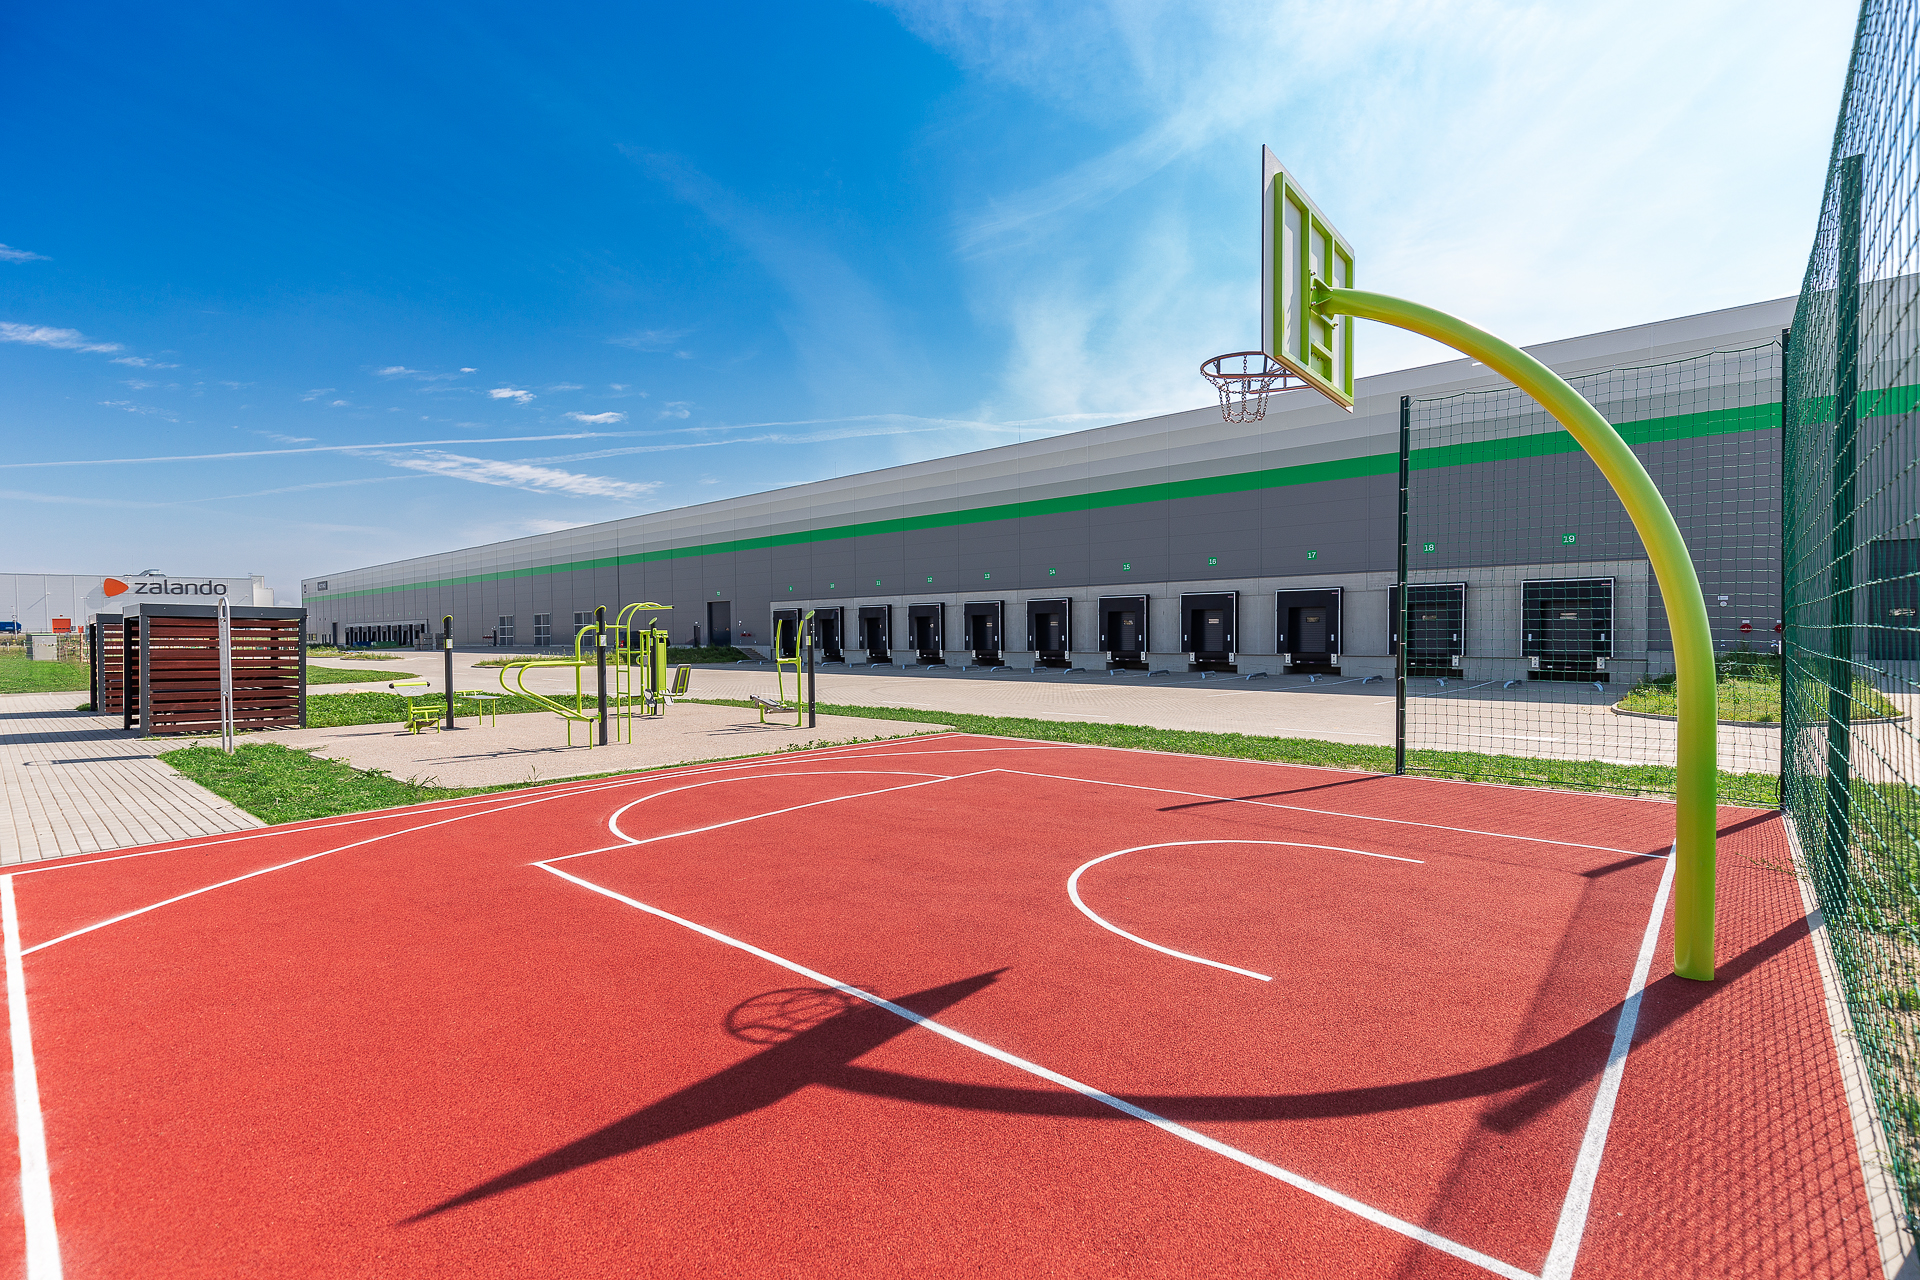
While summer across Europe usually brings a seasonal slowdown, Poland’s industrial and logistics sector moved into high gear through H1 2026. Total modern warehouse space in Poland has now reached roughly 38 million sq m.
If you are currently evaluating your supply chain, distribution, or warehouse footprint, three big market trends stand out:
- Net lease sign-ups jumped 57% year-over-year, driving overall H1 2026 demand to 3.5 million sq m.
- New construction is down 11% year-over-year (1.3 million sq m currently under construction). Crucially, 61% of space being built is already pre-leased. Speculative building has slowed significantly.
- Total warehouse vacancy across Poland dropped from 7.9% down to 6.3%–6.4%.
Key Takeaways
- Tightening in Core Hubs
Availability is splitting into two speeds. The nationwide vacancy average is ~6.3%, but prime spaces in core markets (around the seven main urban agglomerations) are down to 6.0% and projected to drop toward 5.5% by year-end. Peripheral regional markets offer more breathing room, averaging 7.2% vacancy.
- The “Big Five” Still Dominate
Market activity remains concentrated in major hubs: Upper Silesia, Warsaw Suburbs, Wrocław, Central Poland, and Poznań. These five regions accounted for 63% of new supply, 80% of construction, and 82% of all leased space.
- Rent Pressures on Prime Space
While asking headline rents hold steady between €4.20 – €6.50 / sq m / month, effective rents (after incentives) are starting to climb in high-demand, low-vacancy submarkets.
- A Pivot Toward Quality & Automation
Developers and occupiers are shifting focus from rapid area expansion to asset quality, modern automation capabilities, and securing pre-leased space early.
Regional Snapshot (H1 2026)
| Region | Total Space (sqm) | Under Construction (sqm) | Vacancy Rate (%) |
| Upper Silesia | 6.34 M | 321.2 K | 7.3% |
| Warsaw Suburbs | 6.16 M | 315.0 K | 7.2% |
| Wrocław | 5.38 M | 43.9 K | 5.1% |
| Central Poland | 5.16 M | 163.0 K | 4.8% |
| Poznań | 4.50 M | 128.6 K | 5.3% |
| Gdańsk (Tricity) | 1.96 M | 65.9 K | 6.4% |
| Poland Total | 38.55 M | 1.30 M | 6.3% |
With core vacancies tightening toward 5.5% and speculative construction staying limited, how is your organization planning its space and supply chain strategy for late 2026 and 2027?
Data synthesized from market reporting by CBRE, Colliers, Cushman & Wakefield, JLL, Knight Frank, and Savills.